The Very Heart of Marijuana Stock Analysis on Valentine’s Day

I have been married for nearly seven years and we have two beautiful children. Valentine’s Day never meant much to me until I received my first true valentine. So, I am an appreciator of the day and do not mean to be sarcastic.
I believe that identifying support and resistance in the cannabis sector of the market is of the utmost importance. As an IAR, I quickly realized that the most important part of investing or trading is risk management. When I think about risk management I do not only think of cutting losses but also I think of protecting potential profits. Remember, an investor has not actually made any potential money on a position until they exit the holding. It does not matter if a position has been showing potential profits for the last ten years if tomorrow the market drops below the entry point from a decade ago. Virtually 10 years will have been lost, and unfortunately that has happened to many investors. Volatile assets like marijuana stocks require even more of a focus on risk management, though I believe a focused effort on risk management is essential to any investment.
Let’s take a closer look at the largest of cannabis companies simply because it has some nice liquidity which makes for a good example. We will see some ways to identify support and resistance in the market. By the way, support is a price level in a stock that it is struggling getting below and resistance is a price level for which the stock is struggling to get above.

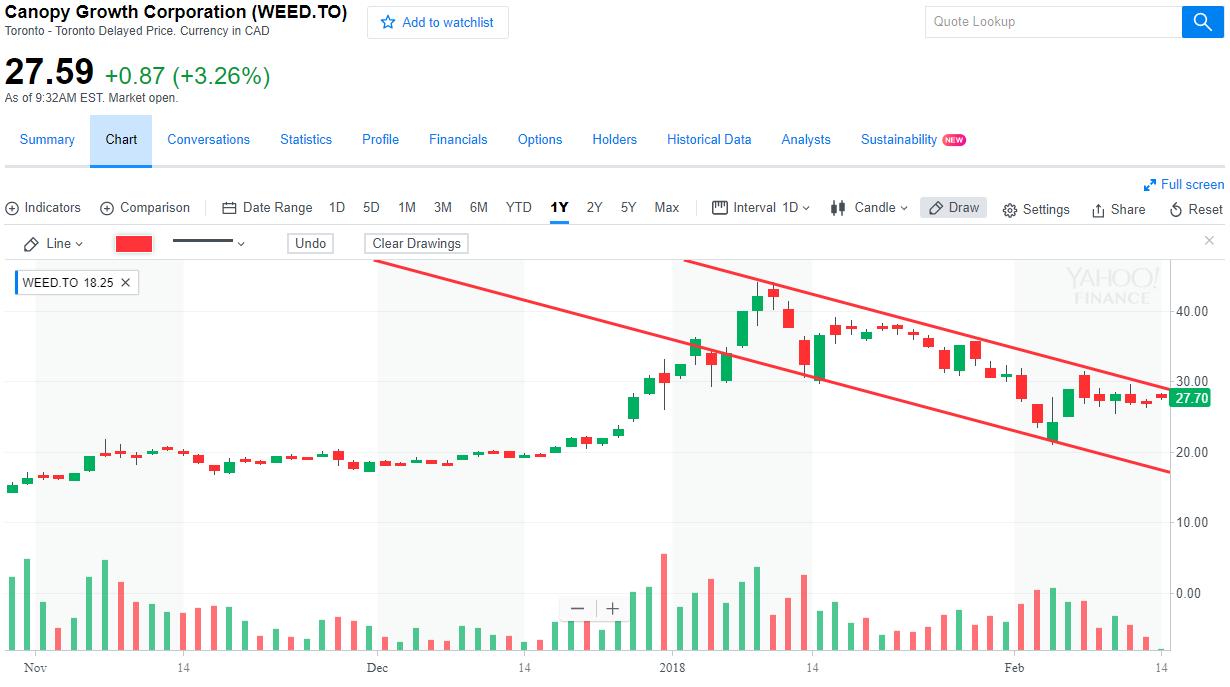
Plainly, Canopy Growth Corporation (WEED:TO) is currently in a downtrend. That does not mean that it is going to stay in a downtrend, but as of right now the channel above illustrates it is currently trending down. Trendlines are one of many ways an analyst could identify support or resistance in a particular market. Taking it a step further we can identify its recent highs and lows during the downtrend.

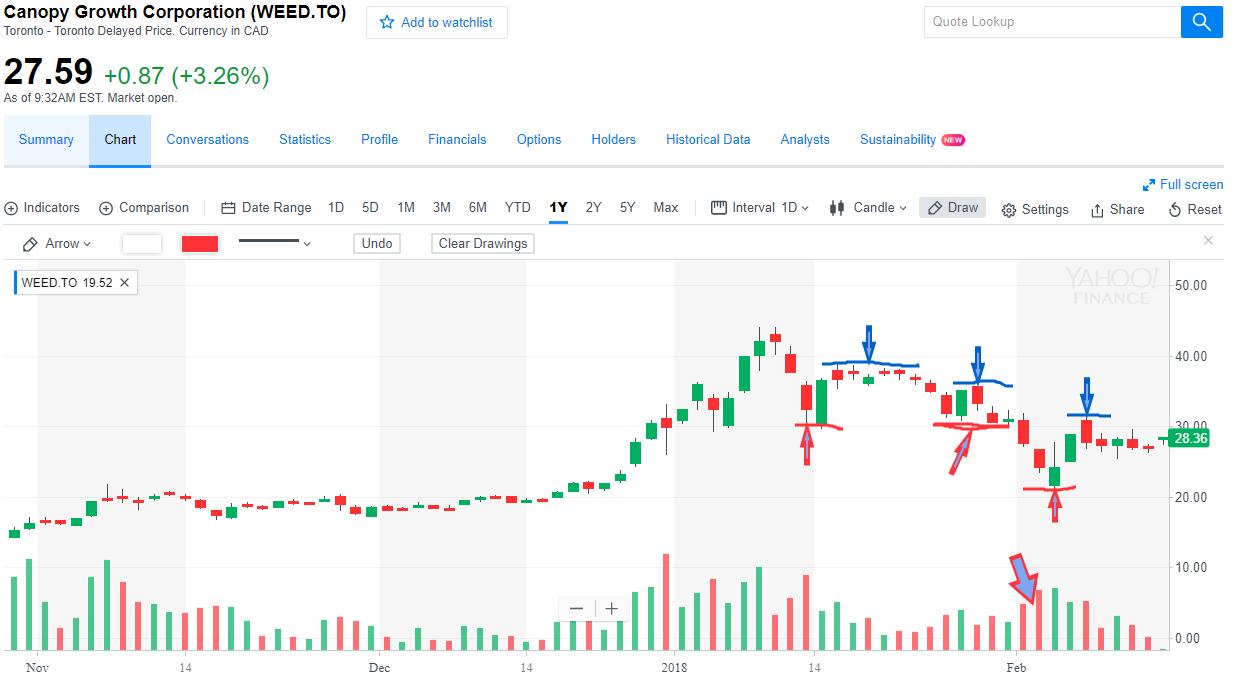
On January 15th (the first red doodle line with the red arrow pointing at it), The Company’s stock price bounced off of about $30/share and found some support. It continuously tests the $30 area again from January 25th – 30th (the second red doodle line with the diagonal red arrow) and the support level holds well until the beginning of February. Take note of the selling volume spike in early February when the stock breaks through the support barrier. You can think about what fundamental event occured to make the market break through, but remember we are reviewing risk management, so what we care about is the market breaking through thresholds. Why its happening does not matter as much as an individual trader’s risk thresholds. As of now, the next major support level is the February 5th low around $21/share.
I am going to emphasize that this is not about predicting where the market is going or about being right or wrong as to where exactly a trader would find support and resistance. It is about a person’s risk threshold. Noone is Warren Buffett, George Soros or Jim Rogers except those people themselves. Most people do not have those legendary investors’ risk tolerance. For Warren Buffett, the 2008 crash represented a good buying or dollar cost averaging opportunity, and he spent no time crying into his milk. For many other people, the 2008 crash was a devastating event. Without a risk management strategy, they would not have had any money to buy anything with. They would have been left with no choice but to hold on and keep their fingers crossed that the market would come back again someday. Which, fortunately it did but at the cost of six year of their investment life until the market reached its previous high found in 2007 again in 2013. An individual needs to know how much they can risk on a position and then choose the support level that matches that risk level and set their exit point. It does not matter what the market did after the fact, all that matters is that a risk threshold was hit.
Let’s say that Canopy Growth Corp.’s share price breaks back above the February 7th high of $31.35/share and a trader decided that was a good value and wanted to take advantage of a potential new uptrend. Let’s also hypothesize that Canopy’s stock does continue to trend up. How much profit should an investor be willing to give up? One of the most eye opening moments I had in my career was when I realized markets trend the minority of the time. Real growth opportunities only happen when a market is actually trending. The market does not trend very often though, most of the time it is stuck in a range. So, it is important to capitalize on the opportunities when they do happen. The same concept of finding support and resistance applies for deciding where to take profits. Buy strength and sell weakness.

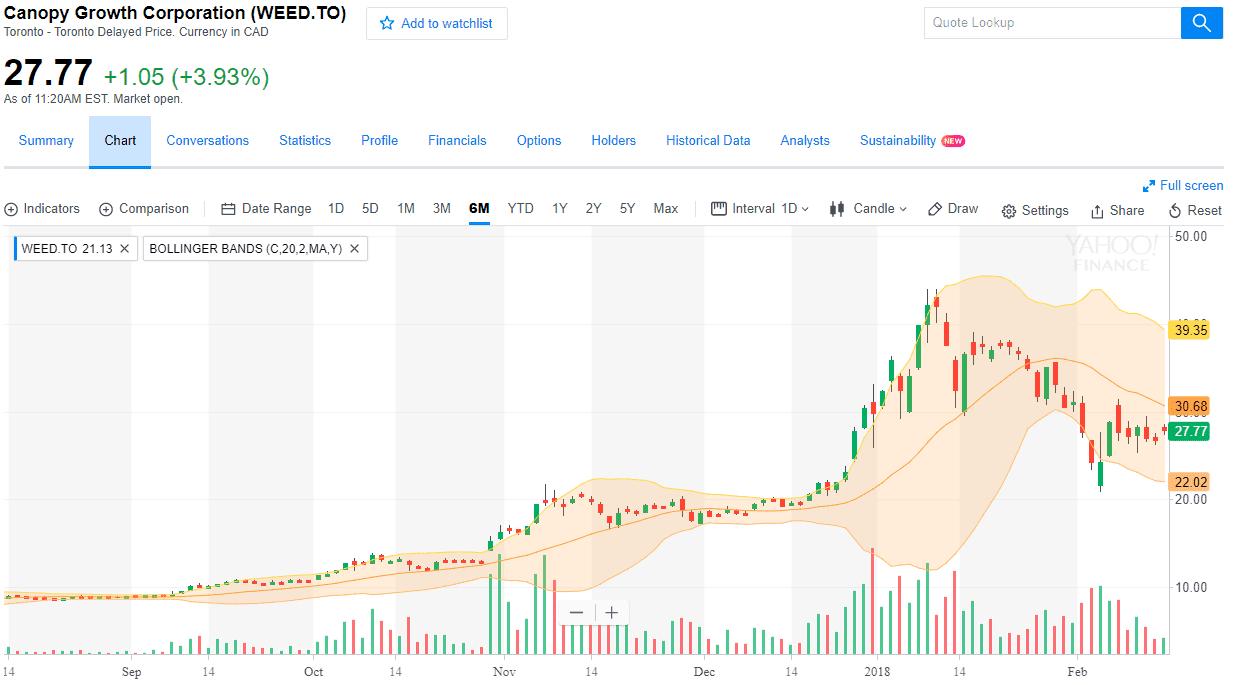
Here we look at another technical indicator that is a bit more complex than trendlines and recent highs and lows. Statistical analysis makes a lot of sense in the market because there are enough data points to really isolate normal distributions and anomalies. What you are looking at in the chart is called a Bollinger band. It simply shows two standard deviations away from a 20 dma. This is the same idea as analyzing test scores with a bell curve. According to this chart the February 5th low, which fell outside one standard deviation below the moving average, ended up being an oversold market and strong buying volume came in pushing the market back up. If instead selling volume increased, the breakout to the downside would have continued and the movement would not have ended up just being an anomaly. While far from foolproof, using standard deviation analysis is another way to set risk parameters.
There are many technical indicators out there and they all have merit. Do not think of them as predictors though. Think of indicators as the structures for which an investor creates their entry points and more importantly their exit points. You could know and understand every technical indicator that exists, but you only have the means to use a small handful of them in a methodical manner. People need to simply pick what makes sense to them and build their entry and exit structure around them. We will continue to review more technical indicators in the future, I am a particular fan of volume analysis.

A lecture.
Maybe this is incorrect, but my impression, having spoken to possibly hundreds of thousands of investors in my career as both a commodity broker and an IAR, is that people are constantly having an internal battle trying to determine if they should spend their time analyzing the market to try and figure out what is going to happen next or whether they should be trying to figure out where to exit the market. My belief is that investors and traders should always be thinking about where to exit. This is true of positions they have not even entered yet. What I mean is that if someone is thinking about entering a position, they should not enter it without knowing where they would exit it if the market begins to work against them. I have had some people reel over this idea because they see it as none other than a losing perspective. But here is the truth, no matter how thoroughly someone analyzes the market, knowing where the market is going to go is a matter of predicting the future. Predicting the future is fantasy. Predicting the future is what they do in Star Wars and Lord of the Rings. It does not happen in reality.
There is some confident trader out there smiling because they have a track record that they think may prove something to the contrary. This person’s discipline is slipping away from them though and their overconfidence will inevitably be the doom of their account. Confident people in the markets often start to over leverage themselves in their confidence. Fight the feelings that suggest that you may have figured the market out. It always worried me when people would start telling me about the patterns they had identified. The market does not have to crash very often to ruin portfolios and years worth of time analyzing the market and staring at computer screens.

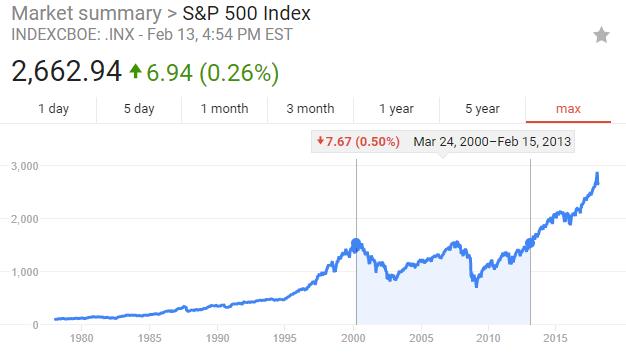
I do not mean to lecture but instead to set a tone here. The cannabis sector of the market offers a great deal of opportunity, but it also offers a great deal of risk. There are long-term plays for investors that are not risk adverse. Long-term investors have to be willing to tolerate large ups and downs in the market. The above image illustrates the U.S. market as a whole in the form of the S&P 500. The highlighted area represents a 13-year stretch of time where the market had essentially done nothing even though it appears as though it did a great deal during the 13-year stretch. A long-term investor would have had to be content virtually making nothing over 13-years with a great deal of volatility and paying fees all along the way. Dividends would have been the only thing that may have saved them. The investor that actually could have capitalized on what were pretty aggressive bull markets from the 80’s until 2000 or from 2003 until 2007 were the ones with exit strategies.
The challenge here is that marijuana stocks have not been around for very long and so using charts to compare them to more mainstream stocks is difficult. What we need to understand is that the youthfulness, the unknown future of the legality of marijuana or the stigma surrounding cannabis makes it a very volatile sector akin to penny stocks. The idea that a long-term bull run in a marijuana stock is on the near-term horizon, like seen in the S&P 500 today, is unlikely for the time being. Either make sure you have plenty of risk capital to tolerate substantial drops and the mental wherewithal as well, or come up with an exit strategy.
Facebook Comments
Tags
Bollinger bandsCanopy Growth Corporationrisk managementtrendlinesvolatility


